It’s been a while since my last post. I just came back from spring training in the Cactus League, the highlight of which was probably my interview with Los Angeles Angels General Manager Billy Eppler.
I listened in as Shohei Ohtani spoke to the media on Saturday, March 2, but it was fairly routine: “How many balls did you hit off the tee today? How many in toss batting?” So when speaking with Eppler I stayed away from the question everybody wants answered, “When is Shohei coming back?” and focused on other things.
Chat with the Angels GM
Below is part of my Q&A with Eppler that didn’t make it into the Kyodo News story HERE.
–Is he unique because he’s unique or because baseball has said it can’t be done?
“I would think there’s a blending of both of those. However, you have to be blessed with the talent on both sides, the ability to work efficiently because you’re not going to have the same time that everybody else is going to have. So raw athleticism, size, speed, strength, efficiency in your work, discipline, those things are unique to him. So probably the majority goes to his uniqueness, I could arbitrarily throw out something like 70 percent is due to him and 30 percent to the other, but that’s cocktail napkin math. A lot of it is his uniqueness.”
–how much did his work habits play into your approach to acquire him?
“We were mindful of that. We understood that. We tried to present that Southern California is a good place to be baseball obsessed. The weather cooperates.”
–How many guys are trying to be two-way players now?
“We have four in our organization. We drafted one in the fourth round, we drafted him as a two-way player. He went out and just hit and was doing his bullpen work on the side. He hadn’t done a ton of functional weight training so we wanted to make sure his strength was up.”
“Of those four, five including Shohei, two of those five are starters and three are trying to be relievers.”
Thanks for the help
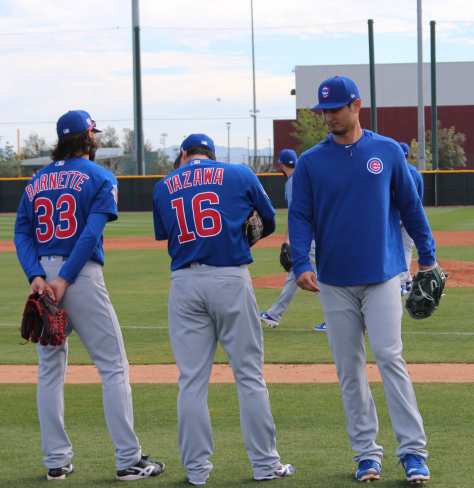
In addition to Eppler, I want to thank all those people who took time out from their busy schedules to chat: Pitchers Jay Jackson, Matt Carasiti, Tony Barnette, Kenta Maeda, Yoshihisa Hirano, former NPB players Matt Murton, Terrmel Sledge, Jim Marshall, Torey Lovullo, Akinori Otsuka, Takashi Saito and Hideki Okajima. Two Angels players, Kaleb Cowart and Albert Pujols, also shared their time.
I also want to thank the media relations staff of the San Diego Padres, Milwaukee Brewers, Chicago Cubs, Arizona Diamondbacks, Seattle Mariners, and Los Angeles Angels and MLB. Because of their help, I was able to make good use of my time. A shoutout also to my Kyodo News colleagues in New York and Arizona for their input and assistance.

